
This page complements our FY25 Sustainability Report, which demonstrates our leadership in the transformation of food systems, highlights the value we deliver to customers and wider society, and showcases our sustainability progress and achievements in the past year. The report was prepared using the European Sustainability Reporting Standards (ESRS) to structure our sustainability statements and to provide an overview of Tetra Pak's sustainability performance for the period 1 January 2025 - 31 December 2025.
*Where FY is mentioned, it refers to Full Year.
Find our FY25 Sustainability Report here
Sustainability performance ratings
The CDP assesses data from over 22,000 companies, ranking them on their transparency, tangible action and environmental leadership. It’s based on data provided by companies on environmental issues such as climate change, deforestation and water security. EcoVadis evaluates companies’ sustainability performance across four pillars: Environment, Labour & Human Rights, Ethics and Sustainable Procurement. Our 2025 score places us in the top 1% of 130,000 companies assessed by EcoVadis in the same period.
| 2023 | 2024 | 2025 | |
|---|---|---|---|
| CDP Climate | A- | A | B |
| CDP Forests | A | A- | A- |
| CDP Water | A- | A- | A- |
| EcoVadis | Gold Medal | Gold Medal | Platinum Medal |

FOOD SYSTEMS
Food Production
Our approach to food systems is centred on our Tetra Pak specific material topics: food access, food production, food loss and waste and consumer health and safety. The work we do, the targets we have set, and the projects we pursue all aim to address these issues and their interconnections.
Here is some data to show the progress we’ve made in 2025.
| 2023 | 2024 | 2025 | ∆% 2025 vs 2024 | 2030 target (baseline) | |
|---|---|---|---|---|---|
| Food production | |||||
| Cumulative number of smallholder farmers involved in Dairy Hub Projects since 2011 | 77,376 | 83,967 | 89,200 | 6% | 100,000 (2011) |
| Cumulative number of Dairy Hub Projects since implementation in 2011 | 25 | 29 | 33 | 14% | |
| Absolute GHG emission reduction of dairy ambient processing lines (tCO2e) since 2019 baseline | -33% | -42% | -35% | -16% | -50% (2019) |
| % of progress towards sales target of plant-based and new-food* processing equipment and technologies vs 2023 baseline | - | 18.1% | 30% | 66% | Triple (2023) |
| Food access | |||||
| Number of children reached by School Feeding Programmes worldwide (million) | 64 | 66 | 68 | 3% | |
| Number of countries participating in School Feeding Programmes worldwide | 49 | 49 | 52 | 6% |
* 'New food sources' is a term broadly referring to any food produced through a combination of new ingredients or innovative new processes. It includes, but is not limited to, the EU definition of 'novel foods' in EU Regulation 2015/2283 on novel foods.
** Progress is reported as a percentage reflecting how close we are to achieving the target.
CIRCULARITY
For us, a circular approach includes extending equipment life, minimising the use of resources in packaging and increasing the use of recycled and renewable materials to reduce pressures on finite resources and ensure that all packaging gets recycled after use.
See below how we’ve progressed in this area in 2025.
Resource inflows
Our cartons are recyclable where collection, sorting and recycling infrastructure exists at scale. By increasing the fibre content and reducing the plastics and aluminium, our packaging becomes more attractive to paper mills and fibre recycles, and easier to recycle.
Materials used for packaging and additional material
Relative proportion of materials used for packaging and additional material*
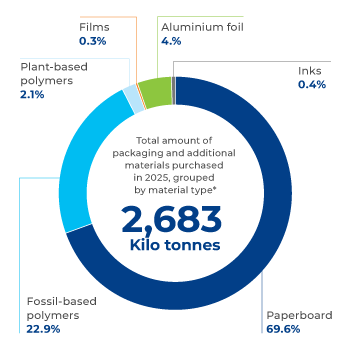
*Excluding tab strips, liners and hotmelts
| Materials used by weight (%) | 2024 | 2025 |
|---|---|---|
| Renewable materials (paperboard & plant-based polymers) | 72% | 72% |
| Non-renewable materials (fossil-polymers, aluminium foil, films & inks) | 28% | 28% |
Resource outflows
We are continually improving the circularity of our packages through collaborations to strengthen collection and recycling rates of food and beverage cartons.
{"exporting":{"buttons":{"contextButton":{"enabled":false}}},"title":{"text":" Plant-based packages and caps growth","align":"left"},"subtitle":{"text":null,"align":"left"},"yAxis":{"title":{"text":"(billion)"}},"xAxis":{"crosshair":false,"categories":null,"accessibility":{"rangeDescription":"Right"}},"legend":{"layout":"horizontal","align":"center","verticalAlign":"bottom"},"plotOptions":{"line":{"legendSymbol":"rectangle"},"series":{"marker":{"symbol":"circle"},"pointStart":2023,"label":{"connectorAllowed":false}}},"series":[{"name":"Plant-based<br>Packages","data":[10.4,11.0,10.8],"color":"#B4DC7A"},{"name":"Plant-based<br>Caps","data":[12.6,12.3,10.1],"color":"#3DBDF3"}]}
{"chart":{"type":"column"},"title":{"text":"Proportion of FSC™ labelled carton packages","align":"left"},"subtitle":{"text":"<p><b>delivered to customers</b></p>\r\n<p> </p>\r\n","align":"left"},"yAxis":{"min":0,"title":{"text":"(billion packages)"}},"tooltip":{},"xAxis":{"crosshair":false,"categories":["Year"],"accessibility":{"description":"Year"}},"legend":{"layout":"horizontal","align":"center","verticalAlign":"bottom"},"series":[{"name":"2023","data":[148.0],"color":"#07699D"},{"name":"2024","data":[148.0],"color":"#8DC63F"},{"name":"2025","data":[145.0],"color":"#3DBDF3"}],"exporting":{"buttons":{"contextButton":{"enabled":false}}}}
Resource outflows continued
Our commitment to circularity extends to how we manage and reduce operational waste.
Our goal is to eliminate all waste sent to landfill or incinerated without energy recovery from our production sites by 2030.
| Waste (tonnes) | 2023 | 2024 | 2025 | ∆% 2025 vs 2024 |
|---|---|---|---|---|
| Total waste1 | 183,968 | 177,125 | 182,127 | 3% |
| Non-hazardous waste | 169,429 | 167,185 | 169,512 | 1% |
| Hazardous waste | 14,539 | 9,940 | 12,615 | 27% |
| Waste management2 | ||||
| Waste to preparation for reuse | - | - | 7,466 | - |
| Waste to material recycling | 171,546 | 167,451 | 164,234 | -2% |
| Waste to other recovery operations | - | - | 380 | - |
| Waste to incineration with energy recovery | 9,390 | 6,604 | 6,556 | -1% |
| Waste to other disposal operations | - | - | 1,621 | - |
| Waste to incineration without energy recovery | 1,366 | 1,468 | 642 | -56% |
| Landfill | 1,666 | 1,602 | 1,228 | -23% |
1. Figures for FY23 and FY24 have been corrected following a methodological review.
2. New waste‑management categories have been introduced in alignment with updated GRI requirements.
We co-invest with players along the collection and recycling value chain globally, in new technologies, in equipment and in facilities to increase collection, sorting and recycling capacities for food and beverage cartons.
| 2023 | 2024 | 2025 | ∆% 2025 vs 2024 | |
|---|---|---|---|---|
| Total amount invested in collection and recycling programmes worldwide (million €) | €40 | €42 | €42 | 1% |
| Total weight of food and beverage cartons collected and sent for recycling (kilo tonnes)1 | 1,291 | 1,358 | 1,286 | -5% |
| Carton Collected for Recycling rate (%)2 of food and beverage cartons | 27% | 28% | 27% |
1. The total volume of food and beverage cartons placed by the entire industry on the market is estimated from externally available industry data and research. The quantity of food and beverage cartons collected for recycling is based on the latest official data published or supplied by reliable sources such as governmental bodies, registered recycling organisations, national industry associations, or non-governmental organisations. In cases where such official data is unavailable, the figure is based on our best estimate.
2. For the whole food and beverage carton volume put to the market by all producers (not only Tetra Pak).
CLIMATE
Our ambition is to take action on mitigating climate change by decarbonising our operations, products and our value chain.
See below how we’ve progressed in this area in 2025.
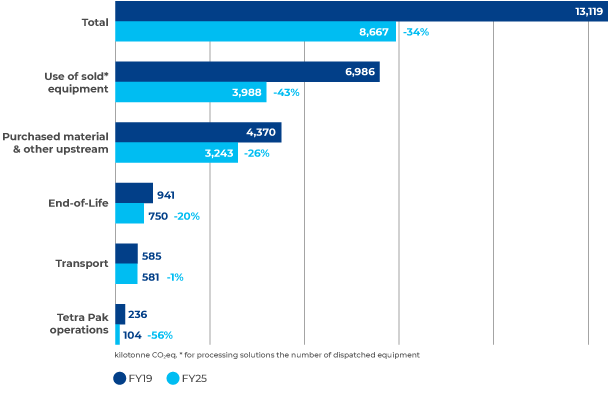
Value chain GHG emissions (k tonnes CO2e)
Climate continued
We are on track to achieve our 2030 GHG emissions target* to reduce absolute scope 1, 2 and 3 GHG emissions by 46% from a 2019 baseline. This follows a further year of progress decarbonising our own operations and helping customers reduce their emissions through the equipment, technology and services we provide.
See further details of this below.
* These targets have been assessed, validated and approved by Science Based Targets initiative. They follow the SBTi Corporate and Near-term Criteria, SBTI Net Zero Standard, and GHG Protocol Corporate standard.
| Tonnes CO2 equivalent ESRS E1-6 | 2019 (baseline) | 2023 | 2024 | 2025 | ∆% 2025 vs 2019 | ∆% 2025 vs 2024 |
|---|---|---|---|---|---|---|
| Scope 1 emissions ✔️ | ||||||
| Direct emissions from owned/controlled operaitons | 80,066 | 64,003 | 58,181 | 54,417 | -32% | -6% |
| Scope 2 emissions ✔️ | ||||||
| Market-based | 112,770 | 43,339 | 27,645 | 22,569 | -80% | -18% |
| Location-based | 347,221 | 353,233 | 357,323 | 343,712 | -1% | -4% |
| Scope 3 upstream emissions ✔️ | ||||||
| C1: Purchased good and services | 4,310,917 | 3,317,481 | 3,627,876 | 3,213,874 | -25% | -11% |
| C3: Fuel and energy-related Activities (not included in Scope 1 or Scope 2) (Market-based) | 59,554 | 34,839 | 31,422 | 29,603 | -50% | -6% |
| C3: Fuel and energy-related Activities (not included in Scope 1 or Scope 2) (Location-based) | 105,330 | 102,571 | 106,237 | 105,435 | 0% | -1% |
| C4: Upstream transportation and distribution | 548,612 | 531,195 | 642,563 | 543,002 | -1% | -15% |
| C5: Waste generated in operations | 2,742 | 1,974 | 1,929 | 1,963 | -28% | 2% |
| C6: Business travel | 42,987 | 22,364 | 30,535 | 27,311 | -36% | -11% |
| Scope 3 downstream emissions ✔️ | ||||||
| C9: Downstream transportation and distribution | 36,317 | 37,062 | 47,032 | 38,406 | 6% | -18% |
| C11: Use of sold products** | 6,986,498 | 5,654,918 | 4,582,011 | 3,987,926 | -43% | -13% |
| C12: End-of-life treatment of sold products | 9,38,580 | 847,661 | 779,737 | 747,664 | -20% | -4% |
| Total Scope 3 (market-based) ✔️ | 12,926,208 | 10,447,494 | 9,743,105 | 8,589,748 | -34% | -12% |
| Total GHG emissions (market-based) ✔️ | 13,119,043 | 10,554,835 | 9,828,931 | 8,666,734 | -34% | -12% |
| Emissions intensity (market-based tonnes CO2e / revenue in million €) | 1,050 | 823 | 767 | 702 | -30% | -8% |
*Categories excluded due to limited impact = 2 (capital goods and services), and 7 (employee commuting). Categories excluded due to not being relevant to Tetra Pak = 8 (upstream leased assets), 14 (franchises), and 15 (investments).
**Categories 10 (Processing of sold products) and 13 (downstream leased assets) are included within category 11.
✔️ = Assured based on criteria of The Greenhouse Gas Protocol from 2013, find the assurance statement here.
| (metric kilotonnes CO2) | 2019 (baseline) | 2023 | 2024 | 2025 |
|---|---|---|---|---|
| Direct biogenic CO2 emissions from combustion of bio-based fuels | 1.62 | 1.86 | 1.82 | 1.81 |
| Indirect biogenic CO2 emissions from landfills and incineration without energy recovery | 156 | 150 | 135 | 134 |
| Indirect biogenic CO2 removals referring to the biogenic content of the raw materials purchased | 2,781 | 2,737 | 2,840 | 2,641 |
| Value chain GHG emissions (ktonsCO2e) and share (%) | 2019 (baseline) | 2023 | 2024 | 2025 | ∆% 2025 vs 2019 | ∆% 2025 vs 2024 |
|---|---|---|---|---|---|---|
| Purchased material & other upstream | 4,370 | 3,352 | 3,659 | 3,243 | -26% | -11% |
| Transport | 585 | 568 | 690 | 581 | -1% | -16% |
| Tetra Pak operations (Scope 1, 2 + business travel) | 236 | 130 | 116 | 104 | -56% | -10% |
| Use of sold equipment | 6,986 | 5,655 | 4,582 | 3,988 | -43% | -13% |
| End of life | 941 | 850 | 782 | 750 | -20% | -4% |
| 2019 (baseline) | 2023 | 2024 | 2025 | ∆% 2025 vs 2024 | Target 2030 | |
|---|---|---|---|---|---|---|
| Renewable electricity consumption in Tetra Pak operations (%) | 72% | 89% | 94% | 97% | 2.9% | 100% |
| Onsite solar photovoltaics (PVs) capacity in megawatts (MW) | 2.7 | 12.7 | 14.7 | 15.3 | 3.9% | - |
We connected our manufacturing facilities to the Common Energy Monitoring Platform (CEMP). Building on the wealth of data now available, we are using these insights to identify and drive improvements across our operations.
Below shows details of our energy consumption and mix.
| Energy consumption and mix | 2019 | 2023 | 2024 | 2025 | ∆% 2025 vs 2024 |
|---|---|---|---|---|---|
| Energy consumption – Fossil sources (MWh) | 576,136 | 355,566 | 301,532 | 263,563 | -13% |
| Coal & coal products | 598 | 0 | 0 | 0 | - |
| Crude oil and petroleum products | 108,168 | 101,734 | 97,028 | 82,711 | -15% |
| Natural gas | 244,209 | 151,456 | 144,082 | 144,181 | 0% |
| Other fossil sources | 0 | 0 | 0 | 0 | - |
| Purchased or acquired heat from fossil sources | 223,162 | 102,376 | 60,422 | 36,671 | -39% |
| Energy consumption – Renewable sources (MWh) | 603,883 | 772,676 | 827,036 | 832,853 | 1% |
| Biomass, biofuels, biogas, hydrogen from renewable sources | 8,017 | 9,140 | 8,960 | 8,886 | -1% |
| Acquired electricity, heat, steam or cooling from renewable sources | 593,738 | 753,054 | 804,738 | 809,748 | 1% |
| Self-generated non-fuel renewable energy | 2,127 | 10,482 | 13,338 | 14,219 | 7% |
| Total energy consumption (MWh) | 1,180,019 | 1,128,243 | 1,128,568 | 1,096,416 | -3% |
| Share of non-renewable energy consumption | 49% | 32% | 27% | 24% | |
| Share of renewable energy consumption | 51% | 68% | 73% | 76% | |
| Energy production (MWh) | 28,673 | 11,261 | 13,936 | 15,047 | 8% |
| Non-renewable energy production | 26,545 | 779 | 599 | 828 | 38% |
| Renewable energy production | 2,127 | 10,482 | 13,338 | 14,219 | 7% |
| Energy intensity from activities in high climate impact sectors1 (MWh/ million €) | 94 | 88 | 88 | 89 | 0.8% |
1. Energy Intensity is based on the total 2025 energy consumption and revenues. All consumed energy is associated with activities in high climate impact sectors “NACE Code C – Manufacturing” and “NACE Code G - Wholesale and Retail Trade”.
NATURE
Our ambition is to reduce the impacts of our value chain on nature and to restore landscapes with our own operations, suppliers and customers, in order to contribute to the halting and reversing of nature loss and the achievement of global water resilience.
See below how we’ve progressed in this area in 2025.
Biodiversity and ecosystems
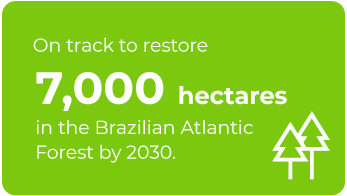
The Araucaria Conservation Programme is our first initiative to restore rural land in the Atlantic Forest in Brazil using native species. The project aims to benefit local communities, the flora and fauna in the region, and global efforts to promote biodiversity and combat climate change.
{"exporting":{"buttons":{"contextButton":{"enabled":false}}},"title":{"text":"Cumulative land under restoration","align":"left"},"subtitle":{"text":"<p>through Araucaria Conservation programme in the Brazilian</p>\r\n<p>Atlantic Forest (hectares) since 2022</p>\r\n","align":"left"},"yAxis":{"title":{"text":"(hectares)"}},"xAxis":{"crosshair":false,"categories":null,"accessibility":{"rangeDescription":"Year"}},"legend":{"layout":"horizontal","align":"center","verticalAlign":"bottom"},"plotOptions":{"line":{"legendSymbol":"rectangle"},"series":{"marker":{"symbol":"circle"},"pointStart":2023,"label":{"connectorAllowed":false}}},"series":[{"name":"Cumulative land under restoration","data":[273.0,1566.0,3205.0],"color":"#3DBDF3"}]}
Nature continued
We work to reduce the use of freshwater across our production sites through applying solutions such as optimising cooling systems, irrigation and domestic water systems, rainwater harvesting, water reuse and circulation.
See further details of our water metrics below.
| Water metrics (megalitres) | 2019 (baseline)1 | 2023 | 2024 | 2025 | ∆% 2025 vs 2019 | ∆% 2025 vs 2024 | Target 2030 |
|---|---|---|---|---|---|---|---|
| Total water withdrawal from all areas in scope of water target* | 2,097 | 1,898 | 1,709 | 1,657 | -21% | -3% | -35% |
| Total water withdrawal from all areas ✔️ | 2,134 | 2,470 | 2,316 | 2,284 | 7% | -1% | |
| Surface water ✔️ | 78 | 537 | 578 | 602 | 675% | 4% | |
| Ground water ✔️ | 605 | 508 | 442 | 490 | -19% | -11% | |
| Seawater ✔️ | - | - | - | - | - | ||
| Produced water ✔️ | - | - | - | - | - | - | |
| Third-party water ✔️ | 1,451 | 1,425 | 1,296 | 1,191 | -18% | -8% | |
| Total water withdrawal from areas with water stress ✔️ | 976 | 945 | 898 | 889 | -9% | -1% | |
| Surface water ✔️ | 78 | 3 | 5 | 1 | -99% | -89% | |
| Ground water ✔️ | 245 | 186 | 175 | 171 | -30% | -2% | |
| Seawater ✔️ | - | - | - | - | - | - | |
| Produced water ✔️ | - | - | - | - | - | - | |
| Third-party water ✔️ | 651 | 756 | 718 | 718 | 10% | 0% | |
| Total water discharge to all areas ✔️ | 1,145 | 1,566 | 1,463 | 1,467 | 28% | 0% | |
| Surface water ✔️ | No data | 685 | 706 | 744 | - | 5% | |
| Ground water ✔️ | No data | 3 | 3 | 3 | - | 3% | |
| Seawater ✔️ | No data | - | - | - | - | - | |
| Third-party water ✔️ | No data | 878 | 755 | 720 | - | -5% | |
| Total water consumption from all areas ✔️ | 989 | 905 | 852 | 817 | -17% | -4% | |
| Water consumption in areas with water stress ✔️ | 571 | 532 | 528 | 557 | -2% | 6% | |
| Water intensity (m3 consumption per m€ revenue) | 86 | 71 | 66 | 66 | -23% | 0% | |
| CDP score for Water | - | A- | A- | A- |
*Our water withdrawal target is broken down per production site with specific targets given to each site depending on their level of water risk. With our site-based targets we aim to achieve a 35% water withdrawal reduction across Tetra Pak production sites by 2030 compared to 2019. The 2019 water baseline for one site has been corrected following a methodological review.
✔️ = Assured based on criteria of GRI 303 standard, find the assurance statement here.
Accounting principles:
For classification of water withdrawal from areas with water stress the WRI Aqueduct tool has been used and site coordinates have been entered into it. We have used ‘Baseline water stress’ (BWS) as an indicator and water stressed areas are those rated ‘High’ or ‘Extremely high’ for BWS.
When it comes to air pollution at our operations, we are adopting the same rigour used for reporting on water and soil. Since 2019, we have both measured this type of pollution consistently and demonstrated progress against our reduction goal by more than halving VOC emissions against that baseline.
| Air pollution metrics (tonnes) | 2019 (baseline) | 2023 | 2024 | 2025 | ∆% 2025 vs. 2024 |
|---|---|---|---|---|---|
| Total VOC emissions in packaging production* | 725 | 454 | 414 | 309 | -57% |
| Reduction in solvent emissions in own operations through production process improvements (%) | - | -29% | -9% | -25% | - |
*Previous years’ VOC emissions figures have been restated following a methodological update.
| 2023 | 2024 | 2025 | |
|---|---|---|---|
| Operational sites assessed on specific environmental risks | - | - | 100% |
We strive to improve the livelihoods of people across the world by giving access to safe food, contributing to economic growth, and respecting human rights in our workplaces, our value chain and the communities we operate in.
See below how we’ve progressed in our performance in this area in 2025.
Our ambition is to have a workplace where every employee is respected, included, engaged, offered fair opportunities and treated equally, irrespective of their background.
See further details below about our employee numbers.
| 2023 | 2024 | 2025 | ||||
| Total number and share of employees | 24,814 | 24,954 | 25,130 | |||
| Female | 5,895 | (24%) | 6,107 | (24%) | 6,225 | (25%) |
| Male | 18,919 | (76%) | 18,847 | (76%) | 18,905 | (75%) |
| Contract type | ||||||
| Total number of permanent employees | 24,297 | 24,443 | 24,645 | |||
| Female | 5,692 | 5,914 | 6,038 | |||
| Male | 18,605 | 18,529 | 18,607 | |||
| Total number of temporary employees | 254 | 259 | 246 | |||
| Female | 76 | 63 | 77 | |||
| Male | 178 | 196 | 169 | |||
| Total number of non-guaranteed hours employees | 263 | 252 | 239 | |||
| Female | 127 | 130 | 110 | |||
| Male | 136 | 122 | 129 | |||
| Employee turnover | ||||||
| Employees who left Tetra Pak (number) | 2,488 | 2,463 | 2,266 | |||
| Rate of employee turnover | 10.1% | 9.9% | 9% | |||
| Employee engagement survey results1 | ||||||
| Employee Engagement score (%) | - | 87% | 87% | |||
| Employee Engagement Participation rate (%) | - | 85% | 85% | |||
1. No historical data shown due changes in methodology and platform used to collect Employee Engagement results in 2024. While we do have historical results related to Employee Engagement, these results would not be fully comparable with the 2024 results.
| Female | Male | Total | |
|---|---|---|---|
| Argentina | 74 | 357 | 431 |
| Brazil | 376 | 1,156 | 1,532 |
| China | 514 | 1,941 | 2,455 |
| Denmark | 99 | 441 | 540 |
| France | 141 | 475 | 616 |
| Germany | 146 | 632 | 778 |
| Hungary | 157 | 301 | 458 |
| India | 262 | 1,296 | 1,558 |
| Italy | 522 | 1,264 | 1,786 |
| Japan | 101 | 487 | 588 |
| Mexico | 251 | 897 | 1,148 |
| Netherlands | 51 | 243 | 294 |
| Pakistan | 29 | 309 | 338 |
| Panama | 192 | 153 | 345 |
| Poland | 94 | 346 | 440 |
| Saudi Arabia | 8 | 242 | 250 |
| Serbia | 125 | 265 | 390 |
| Spain | 192 | 608 | 800 |
| Sweden | 1,168 | 2,487 | 3,655 |
| Switzerland | 96 | 161 | 257 |
| Thailand | 149 | 302 | 451 |
| Türkiye | 74 | 308 | 382 |
| United States | 403 | 1,357 | 1,760 |
| Vietnam | 107 | 482 | 589 |
1. Per country with 250 employees or more representing at least 10% of Tetra Pak’s total number of employees.
| Total number and share (%) ESRS S1-9 | 2023 | 2024 | 2025 | |||
|---|---|---|---|---|---|---|
| Tetra Laval Board1 | ||||||
| Female | 1 | (12%) | 0 | (0%) | 0 | (0%) |
| Male | 8 | (88%) | 8 | (100%) | 8 | (100%) |
| Executive Leadership Team (ELT) | ||||||
| Female | 1 | (10%) | 2 | (18%) | 2 | (20%) |
| Male | 9 | (90%) | 9 | (82%) | 8 | (80%) |
| Senior Management2 | 114 | 118 | 113 | |||
| Female | 29 | (23%) | 32 | (27%) | 30 | (27%) |
| Male | 85 | (77%) | 86 | (73%) | 83 | (73%) |
| Age split for all employees | 24,814 | 24,954 | 25,130 | |||
| Below 30 years | 2,868 | (12%) | 2,905 | (12%) | 2,799 | (11%) |
| 30-50 years | 16,057 | (65%) | 16,007 | (64%) | 15,407 | (61%) |
| Above 50 years | 5,889 | (24%) | 6,042 | (24%) | 6,924 | (28%) |
1. TLG Board members are non-executive and independent.
2. Senior management is defined as Tetra Pak employees in the Executive Leadership Team (which includes our President and CEO & Direct Leader Reports), and ELT -1, excluding Administrative Assistance. Metrics calculated using end-of-period Headcount as of December 31 of the reporting year. The way we define and measure the number of employees in ‘senior management’ positions changed in 2023, hence, 2022 data is not comparable with 2023-2024 data and not reported.
At Tetra Pak, our goal is to create a culture of continuous improvement with our employee learning and development programmes. We encourage curiosity, exploration and a growth mindset in all our colleagues.
Further details on our training and skills metrics are below.
| Training and skills development ESRS S1-13 | 2023 | 2024 | 2025 |
|---|---|---|---|
| Average number of training hours per employee | 18.6 | 17.1 | 18.6 |
| Female | 15.2 | 13.9 | 15.9 |
| Male | 19.7 | 18.1 | 19.5 |
| Total workforce who received career- or skills-related training (%)1 | 88% | 79% | 85% |
| Career management | |||
| Employees that participated in regular performance and career development reviews (%) | 100% | 100% | 100% |
| Number of employees with personal development plans2 | 4,836 | 5,381 | 4,701 |
| Number of internal mobility cases | 4,587 | 3,944 | 2,508 |
1. Training hours are captured from multiple learning systems and include all types of training available at Tetra Pak. The training hours of an employee that left the company before December 31st 2025 are excluded from the calculation, as are trainings performed by consultants.
2. At Tetra Pak we do not have a yearly cycle to close a personal development plan. For this reason, historical data provided for years 2022-2023 is based on an extract from February, 2026.
We are committed to ensuring the health and safety of employees, contractors, visitors and anyone affected by our operations on our own sites or others we operate.
See details of these metrics below.
| 2023 | 2024 | 2025 | |
|---|---|---|---|
| Total fatalities (including contractors) | 0 | 0 | 0 |
| Number of employee recordable work-related accidents | 104 | 94 | 89 |
| Total recordable accident rate (TRAR)1 | 1.82 | 1.63 | 1.57 |
| Number of employees covered with health care2 | - | 16,730 | 16,011 |
| Share of manufacturing sites ISO 45001 certified | 96% | 96% | 98% |
1. Total recordable accident rate = (number of recordable accidents) / work hours x 1,000,000.
2. FY24 numbers reflect an update in the WTW, insurance broker's methodology.
BUSINESS CONDUCT
We are committed to conducting every aspect of our business with integrity, complying with the rule of law and respecting human rights across our operations and throughout our value chain in line with the UN Guiding Principles on Business and Human Rights (UNGPs).
We expect the same level of ethical business conduct within our own operations and among the companies we do business with, including suppliers. This means having policies and processes in place to ensure that business is conducted in a responsible way.
See below how we’ve progressed in our performance in this area in FY25.
Tetra Pak has an established and well-defined Corporate Governance Framework guiding how we conduct business. Everything that we do as a company – developing strategy, taking decisions, and defining how we operate and act – is guided by this framework which helps us to comply with relevant regulations and legislation and guides us to behave ethically and responsibly.
All employees are responsible for fulfilling the principles of our Corporate Governance Framework in their everyday roles. Mandatory trainings are provided to employees to ensure that the highest governance standards are met. By providing the foundation for our strategy and approach to leadership, good governance ultimately helps us fulfil our vision to commit to making food safe and available, everywhere and deliver on our brand promise to PROTECT WHAT’S GOODTM. Read more here.
See further metrics related to the issue below.
| Business ethics metrics | 2023 | 2024 | 2025 |
|---|---|---|---|
| Total workforce trained on business ethics issues (%) | 98% | 98% | 96% |
| Operational sites for which an internal audit/risk assessment concerning business ethics issues has been conducted (%) | 100% | 100% | 100% |
| Number of confirmed information security incidents | 0 | 0 | 0 |
| Operational sites with an information security management system (ISMS) certified to ISO 27000 | 1 | 1 | 1 |
| Number of child or forced labour incidents within own workforce reported | 0 | 0 | 0 |
We request that prioritised suppliers in our Join Us in Protecting the Planet initiative (JUIPP) set a target certified against the SBTi’s Corporate Net-Zero Standard to limit global temperature rise to 1.5⁰C and drive decarbonisation together.
See how this programme looks in numbers for 2025 below.
| 2023 | 2024 | 2025 | |
|---|---|---|---|
| % Spend coverage of the initiative scope (overall, replacing the current BM/E&S split) | 50% | 70% | 66% |
| # of suppliers in scope (overall) | 45 | 142 | 145 |
| % of suppliers scoring “Advanced” JUIPP performance (JUIPP score above 66%) | 9% | 14% | 21% |
| % of suppliers scoring “Maturing” in JUIPP performance (JUIPP score between 33% and 66%) | 31% | 40% | 48% |
| % of suppliers having progressed from a Low (below 33%) score to a Maturing status since last year | - | - | 17% |
| % of suppliers with a valid SBTi target | 20% | 21% | 33% |
| % of suppliers reporting to CDP (Climate) | 56% | 63% | 77% |
| % improvement since last year in suppliers having a mature nature approach, as evaluated by the JUIPP scoring criteria | - | - | 20% |
We prioritise building strong, sustainable and ethical relationships with our suppliers.
Our approach is guided by comprehensive procurement policies and procedures and a commitment to continuous improvement, ensuring that our procurement processes align with our sustainability goals and ethical standards.
At Tetra Pak, we require our suppliers to uphold the standards outlined in the Tetra Pak Code of Business Conduct for Suppliers (the Supplier Code), consisting of 15 fundamental principles. Read more here.
Below features further details around this.
| Sustainable procurement | 2023 | 2024 | 2025 |
|---|---|---|---|
| Suppliers committed to Tetra Pak’s Supplier Code of Conduct (%) | 91% | 97% | 97% |
| Suppliers with contracts that include clauses on environmental, labour, and human rights requirements (%) | 91% | 97% | 97% |
| Upstream salient human rights impacts identified with a dedicatedaction plan in place (%) | - | - | 100% |
| Number of on-site Sedex audits conducted at supplier sites (#) | - | - | 34 |
| Strategic suppliers with a valid EcoVadis assessment (%) | - | - | 86% |
| Suppliers that have provided information on conflict mineral duediligence (%) | - | - | 75% |
| Paperboard volumes from FSCTM certified and other controlled sources (%) | 100% | 100% | 100% |
| ASI aluminium volumes delivered (%) | - | 32% | 72% |
| Plant-based polymer volumes delivered as Bonsucro certified (%) | 100% | 100% | 100% |
| % of recycled polymer volumes delivered as ISCC+ certified | - | - | 100% |
| Audited or assessed suppliers engaged in corrective actions or capacity building | - | - | 100% |
| Procurement staff trained on sustainable procurement topics (%) | - | 91% | 97% |
SOCIAL SUSTAINABILITY